Admissions

Ilma University Karachi Admission 2024 Last Date
Till now, Ilma University does not open admission to any single campus. When it opens…


Jobs & Career
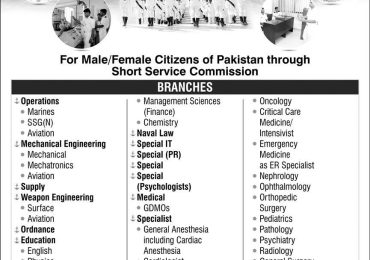
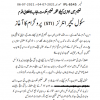
Join Pakistan Navy As Doctor 2024
People looking to Join Pakistan Navy As Doctor 2024 registration has not started till now…